|
The EPS of a company is dependent on the statement of the economy.
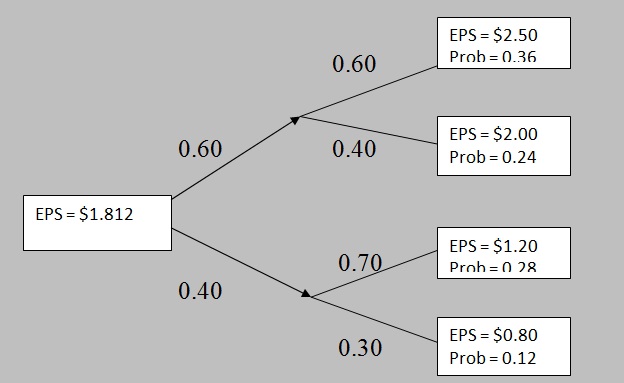
If the economy is good, then there is 60 percent probability that the EPS will be $2.5 and 40 percent probability that the EPS will be $2.0.
If the economy is bad, then there is 70 percent probability that the EPS will be $1.2 and 30 percent probability that the EPS will be $0.8.
The probability of occurrence of a good economy is 60 percent, and that of a bad economy is 40 percent.
Calculate the expected value of the company's EPS using a tree diagram.
Solution:
The conditional value of EPS when the economy is good = 0.60*$2.5 + 0.40*$2.0 = $2.30
The conditional value of EPS when the economy is bad = 0.70*$1.2 + 0.30*$0.8 = $1.08
The unconditional value of EPS = 0.60*$2.30 + 0.40*$1.08 = $1.812
Using tree diagram:
Probability of EPS to be equal to $2.50 = 0.60*0.60 = 0.36 (upper-upper node)
Probability of EPS to be equal to $2.00 = 0.60*0.40 = 0.24 (upper-lower node)
Probability of EPS to be equal to $1.20 = 0.40*0.70 = 0.28 (lower-upper node)
Probability of EPS to be equal to $0.80 = 0.40*0.30 = 0.12 (lower-lower node)
Please note that the sum of probabilities of all nodes is equal to one.
Expected value of EPS = 0.36*$2.50 + 0.24*$2.00 + 0.28*$1.20 + 0.12*$0.80 = $1.812
|